
Yet Another Breast Cancer Dataset Analysis—or So I Thought
When I saw the Breast Cancer Wisconsin dataset again, my first thought was, “This dataset again?” We had already used it in several activities, so I expected another familiar routine.
It’s already been a week since our presentation, and I’m only getting the chance to write about it now. The assignment asked us to analyze the data using three models: regression, a decision tree, and one model of our choice. For each one, we had to present and interpret its confusion matrix. We also had to answer two practical questions: Which model would I recommend to a doctor, and how would I convince the doctor that the model was reliable?
I even had a prediction before I began: random forest would win.
My initial thinking was simple. Random forest is a more complicated algorithm, so surely it should produce the best result. It combines the decisions of many trees, while logistic regression seems almost too straightforward by comparison.
I thought I already knew how the activity would go. But the results - and one question from our instructor - turned it into more than just another breast cancer dataset analysis.
Making a Familiar Dataset Slightly Different
The original dataset contained 569 observations and 30 measured features. Each observation represented a breast mass classified as either benign or malignant.
This time, the assignment asked us to randomly remove three times our age from the dataset.
I am 35, so I removed 105 observations.
That left me with 464 cases: 290 benign and 174 malignant. I used 371 of those cases for training and reserved 93 for testing.
I compared three models:
- Logistic regression
- A decision tree
- A random forest
The work was done in Google Colab, but the code was not the part that stayed with me. What interested me more was how my expectations changed once I stopped looking only at the names of the models and started looking at the mistakes they made.
My Complicated Model Did Not Win
At first, I looked at accuracy.
Logistic regression achieved 98.92% accuracy. The decision tree and random forest both reached 92.47%.
That alone challenged my assumption. Random forest used 300 decision trees, but the much simpler logistic regression performed better.
Then I looked at the confusion matrices, and the difference became even more meaningful.
Logistic regression correctly identified all 58 benign cases in the test set. It also detected 34 of the 35 malignant cases. It missed one malignant case and produced no false alarms.
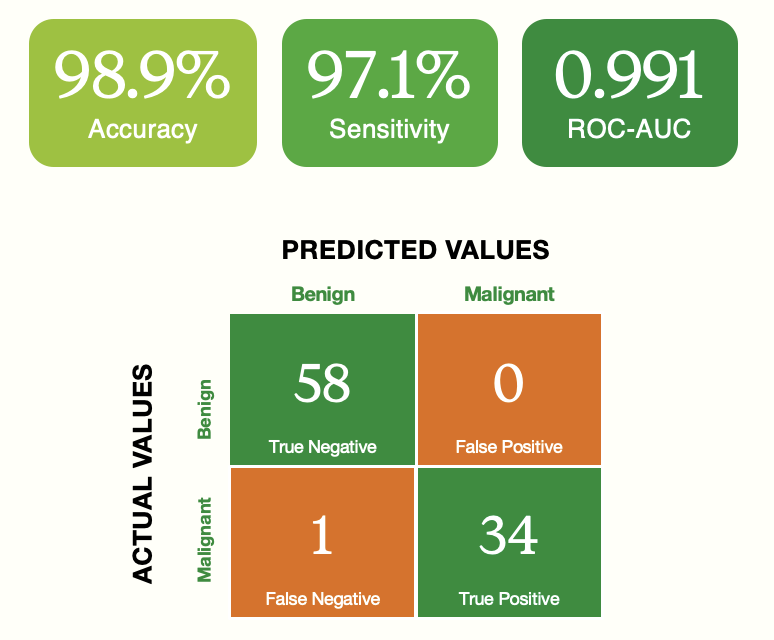
Logistic regression produced the strongest overall results and missed only one malignant case.
The decision tree correctly identified 55 benign and 31 malignant cases. It incorrectly flagged three benign cases and missed four malignant ones.
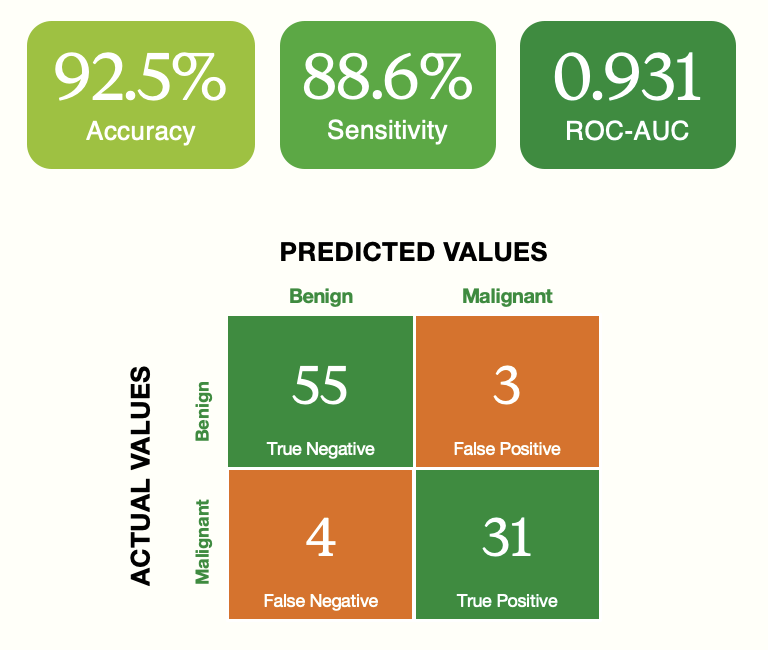
The decision tree made seven incorrect predictions, including four false negatives.
The random forest correctly identified 54 benign and 32 malignant cases. It produced four false alarms and missed three malignant cases.
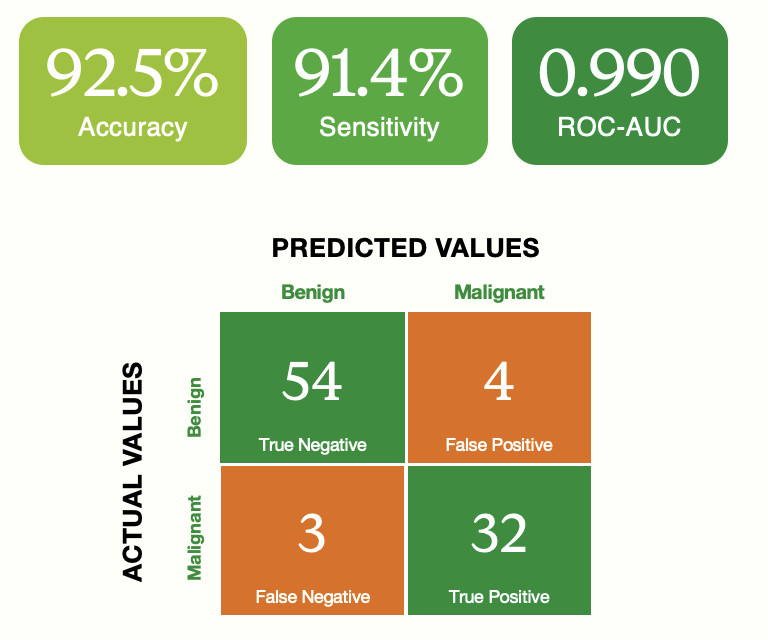
The random forest also made seven incorrect predictions, including three false negatives.
This was where the activity stopped feeling like a simple leaderboard.
In breast cancer classification, not every mistake carries the same weight. If a benign case is classified as malignant, the result could cause fear and lead to unnecessary tests. But if a malignant case is classified as benign, the patient could receive false reassurance and experience a delay in further examination or treatment.
The number that stayed with me was not the 98.92% accuracy. It was the single malignant case that logistic regression missed.
One false negative looks small inside a confusion matrix, but it represents a serious kind of failure.
Why I Would Choose Logistic Regression
For this experiment, I would recommend logistic regression to a doctor.
It achieved the highest accuracy and detected 97.14% of the malignant cases. It also correctly classified every benign case in the test set.
More importantly, it made fewer dangerous mistakes than the other models. Logistic regression missed one malignant case, compared with four for the decision tree and three for the random forest.
It is also relatively easy to explain. A doctor should not be asked to trust a prediction simply because it came from a complicated model. The reasoning, evidence, and limitations behind the result should be understandable.
This activity made me question my belief that a more complicated algorithm must be better. Random forest sounded more powerful because it combined hundreds of trees. Yet it made seven incorrect predictions on the test set, while logistic regression made only one.
Complexity can be useful, but it is not proof of quality.
Of course, this does not mean logistic regression will always outperform random forest. It only means that, for this particular dataset and experiment, the simpler model produced the strongest results.
What I Would Tell a Doctor
If I were presenting the model to a doctor, I would not lead with its accuracy.
I would begin with the confusion matrix. I would explain that the model detected 34 of the 35 malignant cases and correctly classified all 58 benign cases in the test set. I would also be direct about the one malignant case it missed.
I would then show that its performance was not based on only one convenient split of the data. Through five-fold cross-validation, logistic regression achieved an average accuracy of 97.63%, average sensitivity of 95.43%, and average ROC-AUC of 99.55%.
Those results suggest that the model remained strong even when it was trained and evaluated on different portions of the data.
I would also explain that the experiment used a separate test set, preserved the proportion of benign and malignant cases, and followed a reproducible process.
Still, I would not describe the model as ready for clinical use. This was a classroom experiment using a relatively small public dataset. A hospital would need to validate it using independent patient data from different populations and clinical settings. The model would also need to be checked for bias and monitored over time.
I would recommend logistic regression as the best model in my experiment, not as a replacement for a doctor.
The Question We All Missed
At the end of all the presentations, our instructor pointed out something that none of us had really explored:
What if we tested the observations we removed?
I had treated the 105 observations as data that simply had to disappear because the instructions said to remove them. Once they were removed, I focused on splitting and testing the remaining 464 cases.
But those removed observations could have become another useful test.
The 93-case test set came from the same reduced dataset used during the experiment. The 105 removed cases, meanwhile, had been kept completely outside that process. Testing the final model on them could have given us another perspective on how well it handled unseen data.
That comment made me realize how easily we can follow the steps of an assignment without questioning what else the data might tell us.
We had compared algorithms, calculated multiple metrics, created confusion matrices, and performed cross-validation. Those were all useful. But we had not stopped to ask what could be learned from the data we intentionally set aside.
For me, that was probably the most important lesson of the activity.
What Stayed With Me
I began with a familiar dataset and a confident prediction that random forest would win.
Instead, the simpler logistic regression performed best. It made the fewest mistakes, missed the fewest malignant cases, and remained consistent during cross-validation.
But the activity also left me with a new question: How would the model perform on those 105 removed observations?
That question does not undo the results. It shows that there was still more to investigate.
What looked like yet another breast cancer dataset analysis ended up changing how I think about model evaluation. The most valuable part was not finding the winning model. It was realizing that we had never tested the data we removed.
I used to think model evaluation was mainly about comparing accuracy scores. Now I see it as a process of questioning the entire experiment: what data we used, what data we ignored, what kinds of mistakes the model made, and what other tests we could have performed.
Behind every square in a confusion matrix is a person who could be told that something is wrong - or that everything is fine.
That makes choosing and testing a model more than a technical exercise. It makes it a responsibility.